We caught up with the brilliant and insightful Gabrielle Merite a few weeks ago and have shared our conversation below.
Gabrielle, looking forward to hearing all of your stories today. Let’s start with what makes profitability in your industry a challenge – what would you say is the biggest challenge?
The data visualization field currently sits between three fields: design, journalism and data science. This impacts all aspects of our field: the positions offered internally (rare and hard to define), the education available (very little dedicated university path), and the budgets that are dedicated to data visualization.
Personally, I see it all the time as an independent. Budgets for UX design (which is very close to data visualization) can be almost 10 times budgets for data visual journalism or data illustration. This is true for design in general, but the gap seems to be way wider when it comes to data visualization.
This confusion also makes it difficult to market our skills. Depending on the audience or the person who contacts me, I regularly change my title “UX/UI designer”, “Data visualization design”, ” data storyteller”, “Designer for impact with data expertise”, “information designer”, “illustrator”, “infographics designer”… the list goes on.
Somehow, there is a silverlining. Data visualization is growing exponentially. We’ve seen new dedicated Masters launched, new studios, more acknowledgement from the design and journalism community e.g Mona Chalabi, data journalist, just won a Pulitzer price for Illustrated Reporting and Commentary.
What it means for newcomers and growing studios like mine? That currently, there is a lot of space for all of us to exist. With very little competition.
Gabrielle, love having you share your insights with us. Before we ask you more questions, maybe you can take a moment to introduce yourself to our readers who might have missed our earlier conversations?
I’m an information designer helping ethically-driven organisations uncover important truths, and share stories with intention. Backed by data. What does that mean, practically? That my focus is set on designing anything that carries information: infographic, chart, website, report, dashboard…. Always with the goal of making the world a better place.
This all started back when I was studying Immunology (my M.S is in Human Biology). I loved the lab, researching cures for cancer and immune defects. However, no one outside of scientists seem to care about research, or even understand why it mattered so much. And if COVID has proven anything, is that research is essential to the well-being of our population globally.
Why did no one care? Because most scientists weren’t equipped with the communication tools to share their insights and the value of their work. We’ve seen enough charts. Enough tables. Enough plotted points to zZz-ify onlookers. I was ready for something different – to surpass the ordinary. So I made it mission: to communicate your values & findings with honesty, rawness and compassion.
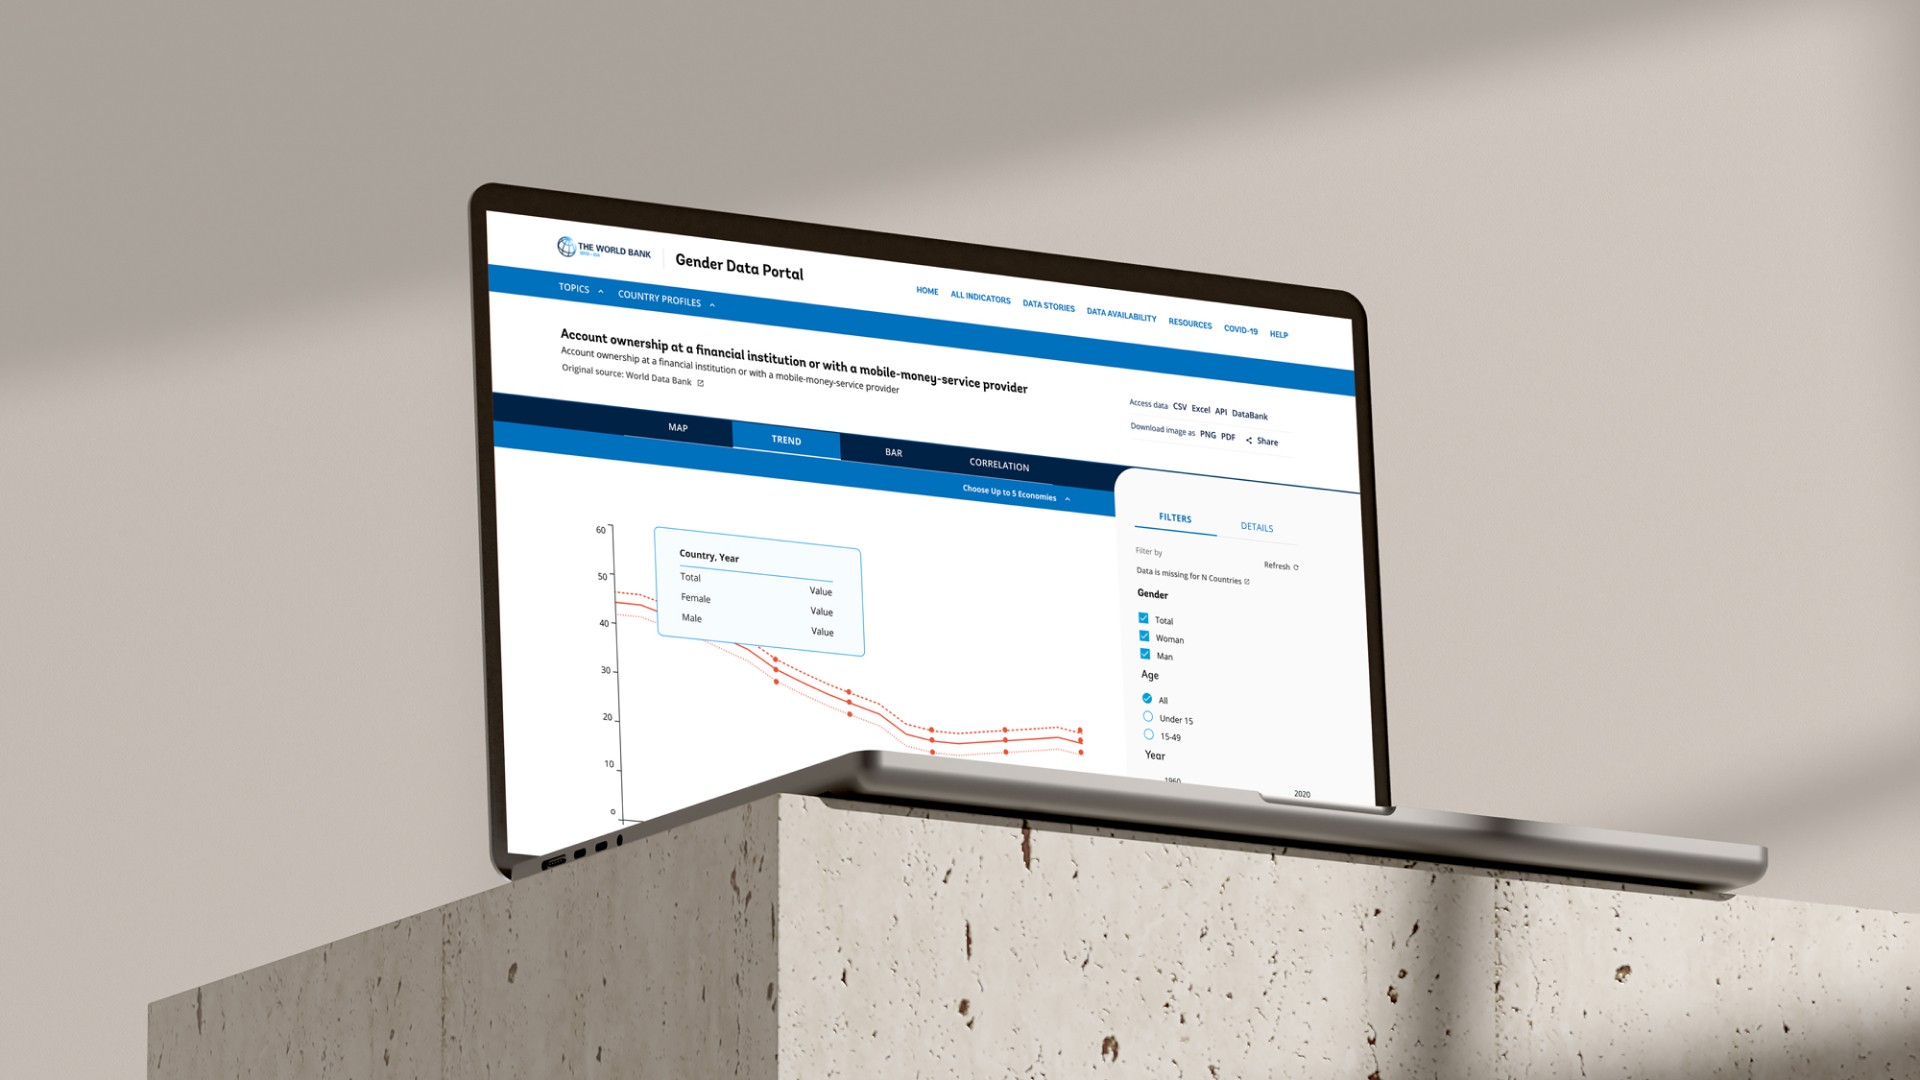
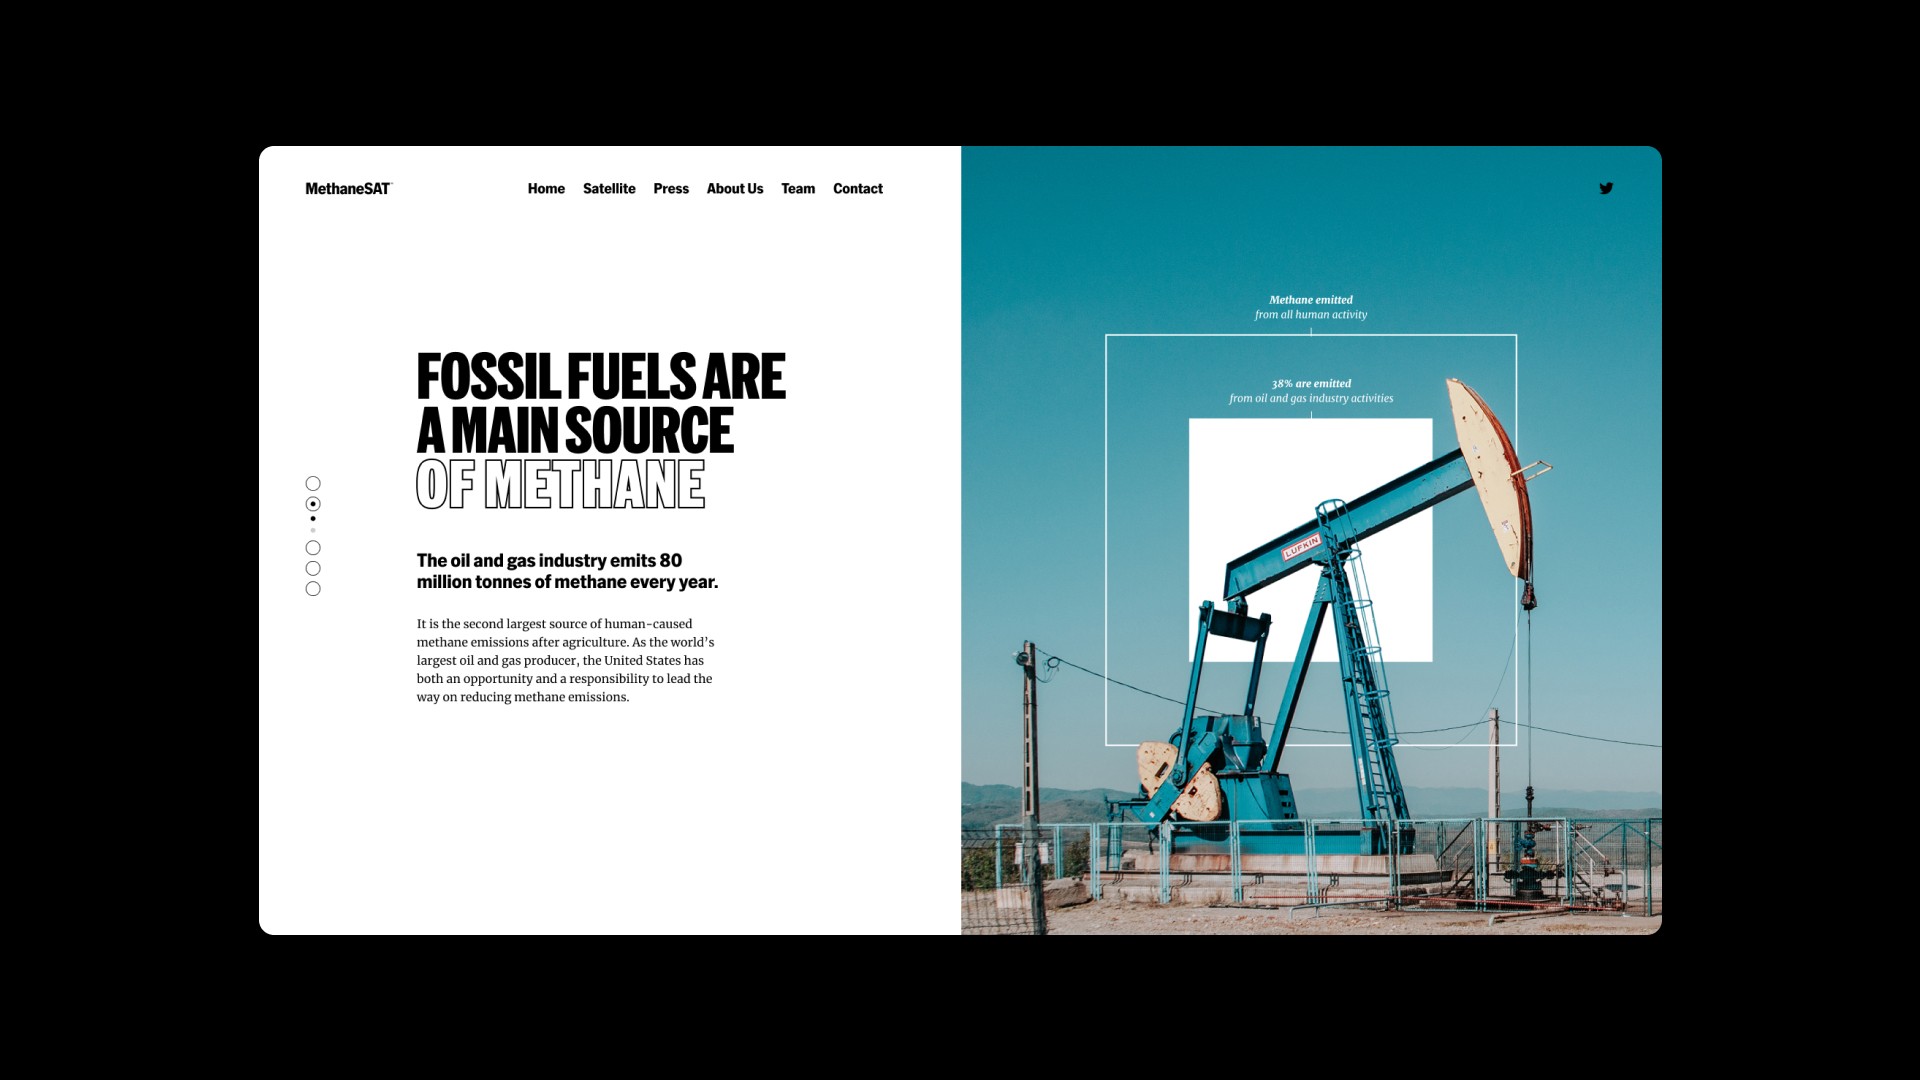
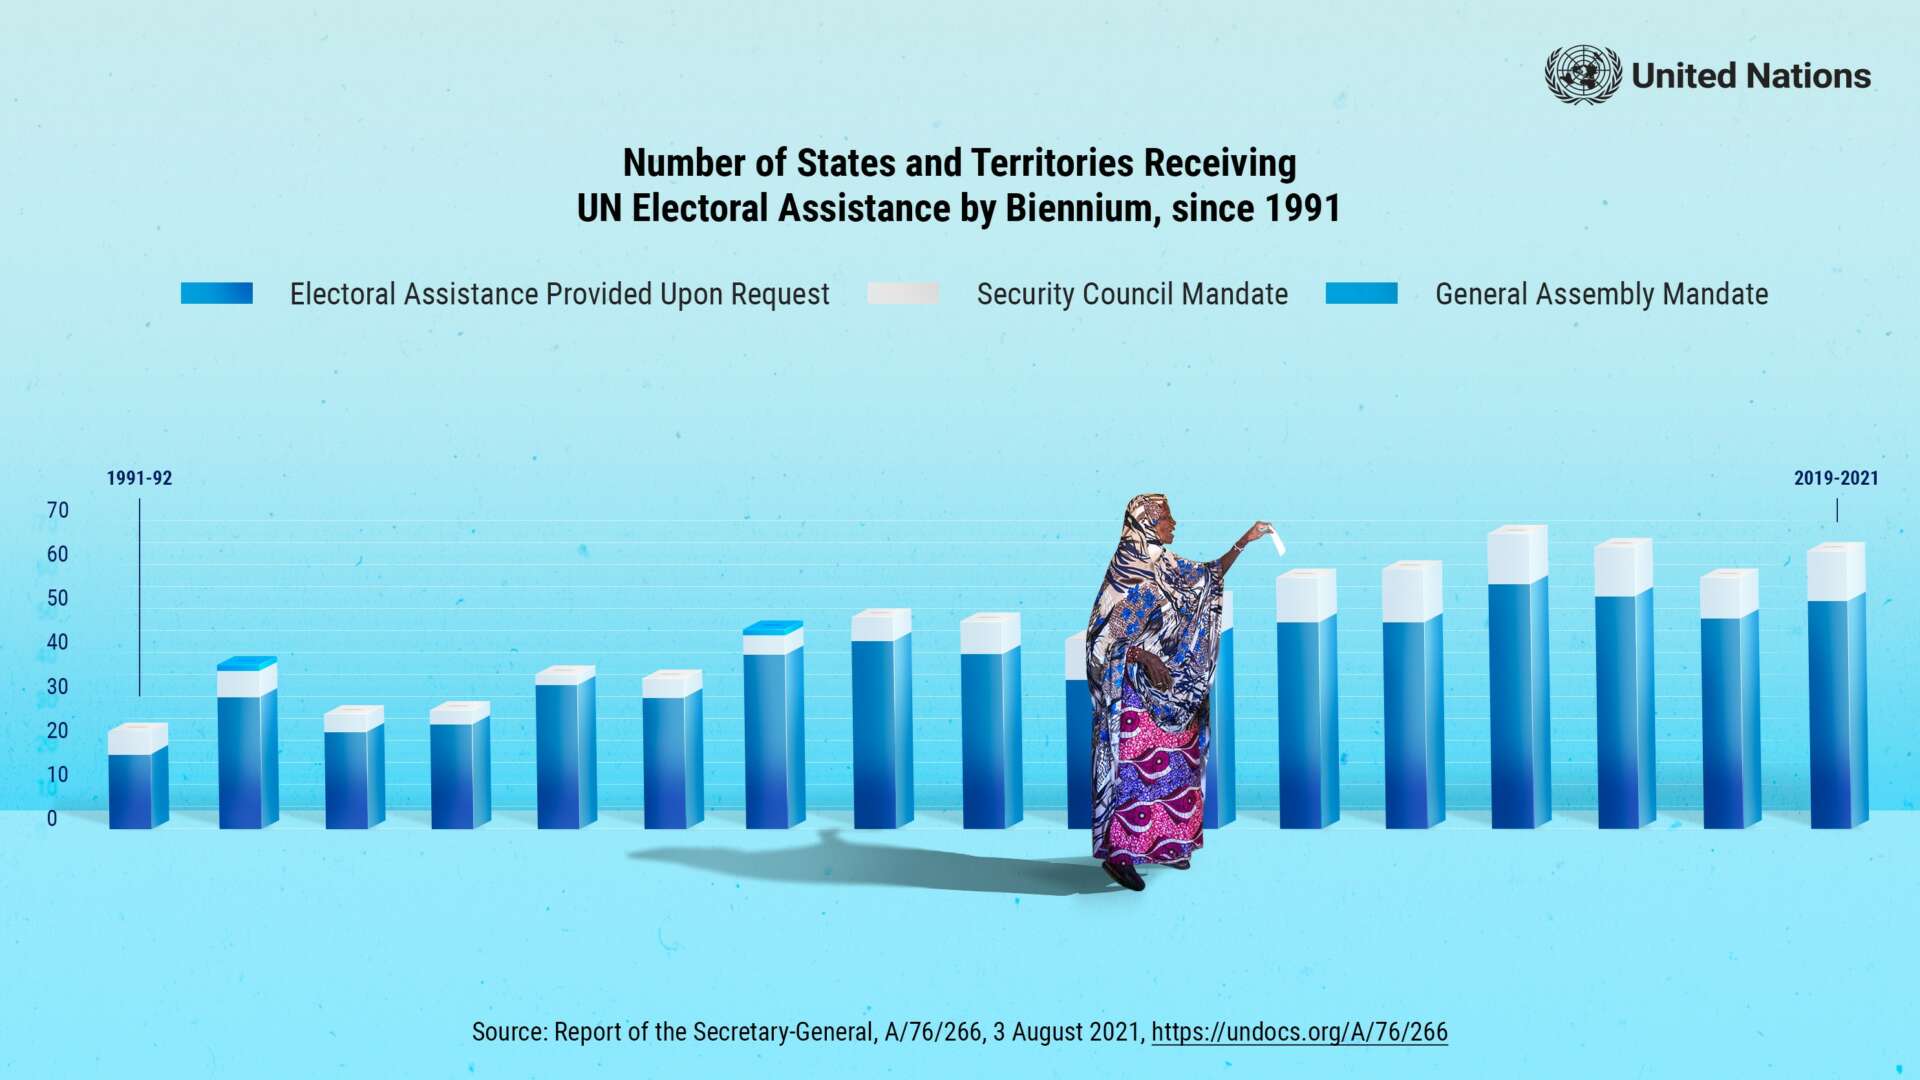
Today, I like to say that I make the cold hard facts feel warm and *living*. Through unexpected visuals and heart wrenching stories weaving data through, I want to make the people behind the dots matter. I’m incredibly grateful that I get to work with teams that share my vision, at the United Nations, WeTransfer, the World Bank, 350, or Harvard University. I help them
We’d love to hear the story of how you turned a side-hustle into a something much bigger.
Back in 2015, I didn’t know data visualization was a thing. In fact, it barely existed and there were close to no position dedicated to us. When I decided to focus on becoming an information designer, I was still working in scientific communication. I knew I could learn, but learning on my own was hard. So I started with weekly classes: first drawing, then photoshop, then illustrator. Then finally, I put all my savings into Certificate of Design at UCLA. This allowed me to work while studying – classes happened at night, three times a week.
Coming out of school, student visas only allow us to work within the field we had studied. For me, it was design. So I took any design job I could. The first one? Making shampoo bottles brand & print design. The second: Doing creative direction for a food company. And on the side, I grew my information design business.
My first projects came through all colleagues. They had small needs: infographics about the key numbers of the year of a science institution, a small 15 page report… But I wanted more, I also wanted to explore new ways of presenting data. Outside of the constraints of large institutional visual identities. I started my Data Doodles project, several times a week, I’d illustrate data that mattered to me, in creative ways. And posted it in on instagram. It launched my career and became “my style”. Two years later, I had saved up 6 months of savings, I quit my job and went freelance full-time.
What’s worked well for you in terms of a source for new clients?
Honestly it’d be hard to define the best source for new clients. For a long time, Instagram was the main source. Then it was Behance as I developed a portfolio there, aiming to catch the idea of creative directors of large studios. Nowadays, I like to use a technique that I affectionally name “warm stalking”.
There are organisations that I’d LOVE to work with (hi Hyperakt!) or sometimes specific people. I usually start. by following them on every social media possible. Not for marketing purposes but purely out of interest, to better understand what they stand for, who they work with, how they like to work. Then I often, like to get to know the people behind the brand so I dig into Linkedin to figure out who they are and how I can stay updated on them. My goal is to learn as much as I can, participate to any discussion they are part of. Almost like a mentorship, without them knowing they are mentors. Because I interact with their content, they often start recognizing my name (at least I hope!) and one day, if they need me, they’ll have my work in mind.
Note: I never do cold out reach. I’m shy in many ways and find these out-of-the-blue emails and DMs very invasive. If anything, I want new clients to come to me, rather than me coming to them.
Contact Info:
- Website: https://gabriellemerite.com/
- Instagram: https://www.instagram.com/gab.md/
- Linkedin: https://www.linkedin.com/in/gabrielle-merite/
- Twitter: https://twitter.com/Data_Soul
- Youtube: https://www.youtube.com/@elevatedataviz